## Summary

This commit is a proposal for handling duplicate installation of DevTools, in particular scoped to duplicates such as a dev build or the internal versions of DevTools installed alongside the Chrome Web Store extension.

Specifically, this commit makes it so when another instance of the DevTools extension is installed alongside the extension installed from the Chrome Web Store, we don't produce a stream of errors or crash Chrome, which is what would usually happen in this case.


### Detecting Duplicate Installations

- First, we check what type of installation the extension is: from the Chrome Web Store, the internal build of the extension, or a local development build.
- If the extension is from the **Chrome Web Store**:
  - During initialization, we first check if the internal or local builds of the extension have already been installed and are enabled. To do this, we send a [cross-extension message](https://developer.chrome.com/docs/extensions/mv3/messaging/#external) to the internal and local builds of the extension using their extension IDs.
    - We can do this because the extension ID for the internal build (and for the Chrome Web Store) is a stable ID.
    - For the local build, at build time we hardcode a [`key` in the `manifest.json`](https://developer.chrome.com/docs/extensions/mv2/manifest/key/) which allows us to have a stable ID even for local builds.
  - If we detect that the internal or local extensions are already installed, then we skip initializing the current extension altogether so as to not conflict with the other versions. This means we don't initialize the frontend or the backend at all.
- If the extension is the **Internal Build**:
  - During initialization, we first check if the local builds of the extension has already been installed and is enabled. To do this, we send a [cross-extension message](https://developer.chrome.com/docs/extensions/mv3/messaging/#external) to the local build of the extension using its extension ID.
    - We can do this for the local build because at build time we hardcode a [`key` in the `manifest.json`](https://developer.chrome.com/docs/extensions/mv2/manifest/key/) which allows us to have a stable ID even for local builds.
  - If we detect that the local extension is already installed, then we skip initializing the current extension altogether so as to not conflict with the that  version. This means we don't initialize the frontend or the backend at all.
- If the extension is a **Local Dev Build**:
  - Since other extensions check for the existence of this extension and disable themselves if they detect it, we don't need any special handling during initialization and assume that there are no duplicate extensions. This means that we will generally prefer keeping this extension enabled.

This behavior means that the order of priority for keeping an extension enabled is the following:

1. Local build
2. Internal build
3. Public build


### Preventing duplicate backend initialization

Note that the backend is injected and initialized by the content script listening to a message posted to the inspected window (via `postMessage`). Since the content script will be injected twice, once each by each instance of the extension, even if we initialize the extension once, both content scripts would still receive the single message posted from the single frontend, and it would then still inject and initialize the backend twice.

In order to prevent this, we also add the extension ID to the message for injecting the backend. That way each content script can check if the message comes from its own extension, and if not it can ignore the message and avoid double injecting the backend.

### Other approaches

- I considered using the [`chrome.management`](https://developer.chrome.com/docs/extensions/reference/management/) API generally to detect other installations, but that requires adding additional permissions to our production extension, which didn't seem ideal.
- I also considered a few options of writing a special flag to the inspected window and checking for it before initializing the extension. However, it's hard to avoid race conditions in that case, and it seemed more reliable to check specifically for the WebStore extension, which is realistically where we would encounter the overlap.

### Rollout

- This commit needs to be published and rolled out to the Chrome Web Store first.
- After this commit is published to the Chrome Web Store, any duplicate instances of the extension that are built and installed after this commit will no longer conflict with the Chrome Web Store version.

### Next Steps

- In a subsequent PR, I will extend this code to show a warning when duplicate extensions have been detected.

Part of #22486

## How did you test this change?

### Basic Testing

- yarn flow
- yarn test
- yarn test-build-devtools

### Double installation testing

Testing double-installed extensions for this commit is tricky because we are relying on the extension ID of the internal and Chrome Web Store extensions, but we obviously can't actually test the Web Store version (since we can't modify the already published version).

In order to simulate duplicate extensions installed, I did the following process:

- Built separate extensions where I hardcoded a constant for whether the extension is internal or public (e.g. `EXTENSION_INSTALLATION_TYPE = 'internal'`). Then I installed these built extensions corresponding to the "internal" and "Web Store" builds.
- Build and run the regular development extension (with `yarn build:chrome:dev && yarn test:chrome`), using the extension IDs of the previously built extensions as the "internal" and "public" extension IDs.

With this set up in place, I tested the following on pages both with and without React:

- When only the local extension enabled, DevTools works normally.
- When only the "internal" extension enabled, DevTools works normally.
- When only the "public" extension enabled, DevTools works normally.
- When "internal" and "public" extensions are installed, "public" extension is disabled and "internal" extension works normally.
- When the local extension runs alongside the other extensions, other extensions disable themselves and local build works normally.
- When we can't recognize what type of build the extension corresponds to, we show an error.
- When all 3 extensions are installed and enabled in all different combinations, DevTools no longer produces errors or crashes Chrome, and works normally.
react-devtools
React DevTools is available as a built-in extension for Chrome and Firefox browsers. This package enables you to debug a React app elsewhere (e.g. a mobile browser, an embedded webview, Safari, inside an iframe).
It works both with React DOM and React Native.
Installation
Install the react-devtools package. Because this is a development tool, a global install is often the most convenient:
# Yarn
yarn global add react-devtools

# NPM
npm install -g react-devtools
If you prefer to avoid global installations, you can add react-devtools as a project dependency. With Yarn, you can do this by running:
yarn add --dev react-devtools
With NPM you can just use NPX:
npx react-devtools
Usage with React Native
Run react-devtools from the terminal to launch the standalone DevTools app:
react-devtools
If you're not in a simulator then you also need to run the following in a command prompt:
adb reverse tcp:8097 tcp:8097
If you're using React Native 0.43 or higher, it should connect to your simulator within a few seconds.
Integration with React Native Inspector
You can open the in-app developer menu and choose "Show Inspector". It will bring up an overlay that lets you tap on any UI element and see information about it:
However, when react-devtools is running, Inspector will enter a special collapsed mode, and instead use the DevTools as primary UI. In this mode, clicking on something in the simulator will bring up the relevant components in the DevTools:
You can choose "Hide Inspector" in the same menu to exit this mode.
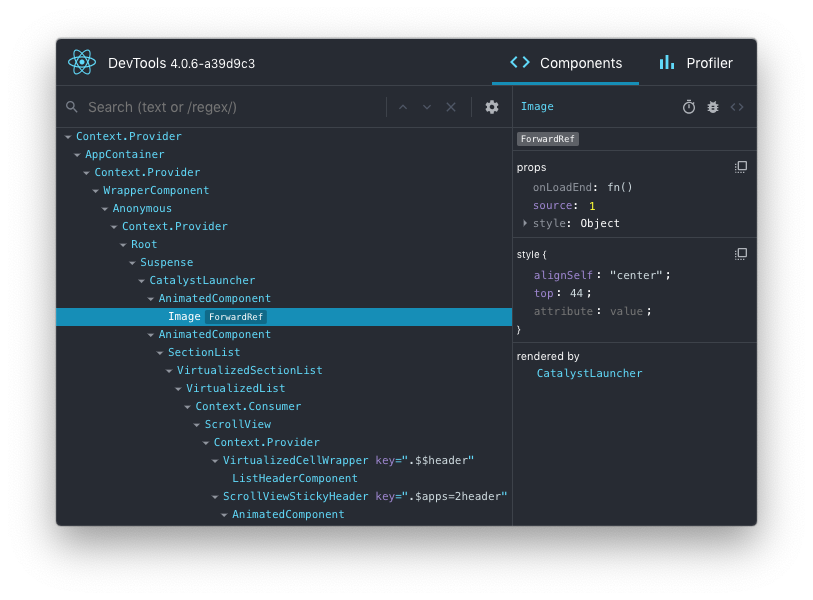
Inspecting Component Instances
When debugging JavaScript in Chrome, you can inspect the props and state of the React components in the browser console.
First, follow the instructions for debugging in Chrome to open the Chrome console.
Make sure that the dropdown in the top left corner of the Chrome console says debuggerWorker.js. This step is essential.
Then select a React component in React DevTools. There is a search box at the top that helps you find one by name. As soon as you select it, it will be available as $r in the Chrome console, letting you inspect its props, state, and instance properties.
Usage with React DOM
The standalone shell can also be useful with React DOM (e.g. to debug apps in Safari or inside of an iframe).
Run react-devtools from the terminal to launch the standalone DevTools app:
react-devtools
Add <script src="http://localhost:8097"></script> as the very first <script> tag in the <head> of your page when developing:
<!doctype html>
<html lang="en">
  <head>
    <script src="http://localhost:8097"></script>
This will ensure the developer tools are connected. Don’t forget to remove it before deploying to production!
If you install
react-devtoolsas a project dependency, you may also replace the<script>suggested above with a JavaScript import (import 'react-devtools'). It is important that this import comes before any other imports in your app (especially beforereact-dom). Make sure to remove the import before deploying to production, as it carries a large DevTools client with it. If you use Webpack and have control over its configuration, you could alternatively add'react-devtools'as the first item in theentryarray of the development-only configuration, and then you wouldn’t need to deal either with<script>tags orimportstatements.
Advanced
By default DevTools listen to port 8097 on localhost. If you need to customize host, port, or other settings, see the react-devtools-core package instead.
FAQ
The React Tab Doesn't Show Up
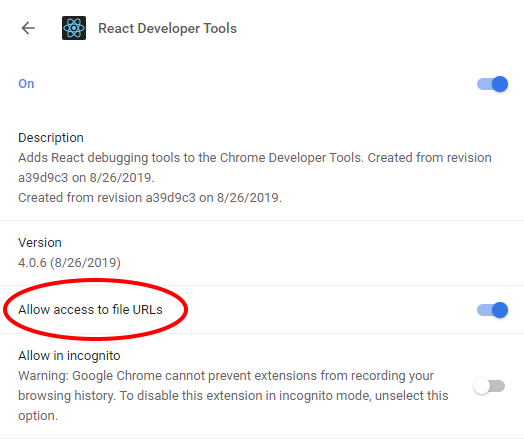
If you are running your app from a local file:// URL, don't forget to check "Allow access to file URLs" on the Chrome Extensions settings page. You can find it by opening Settings > Extensions:
Or you could develop with a local HTTP server like serve.
The React tab won't show up if the site doesn't use React, or if React can't communicate with the devtools. When the page loads, the devtools sets a global named __REACT_DEVTOOLS_GLOBAL_HOOK__, then React communicates with that hook during initialization. You can test this on the React website or by inspecting Facebook.
If your app is inside of CodePen, make sure you are registered. Then press Fork (if it's not your pen), and then choose Change View > Debug. The Debug view is inspectable with DevTools because it doesn't use an iframe.
If your app is inside an iframe, a Chrome extension, React Native, or in another unusual environment, try the standalone version instead. Chrome apps are currently not inspectable.
If you still have issues please report them. Don't forget to specify your OS, browser version, extension version, and the exact instructions to reproduce the issue with a screenshot.
Local development
The standalone DevTools app can be built and tested from source following the instructions below.
Prerequisite steps
DevTools depends on local versions of several NPM packages1 also in this workspace. You'll need to either build or download those packages first.
1 Note that at this time, an experimental build is required because DevTools depends on the createRoot API.
Build from source
To build dependencies from source, run the following command from the root of the repository:
yarn build-for-devtools
Download from CI
To use the latest build from CI, run the following command from the root of the repository:
./scripts/release/download-experimental-build.js
Build steps
You can test the standalone DevTools by running the following:
- First, complete the prerequisite steps above! If you don't do it, none of the steps below will work.
- Then, run
yarn start:backendandyarn start:standalonein../react-devtools-core - Run
yarn startin this folder - Refresh the app after it has recompiled a change
- For React Native, copy
react-devtools-coreto itsnode_modulesto test your changes.